2024 Fall Gradebook Analysis

View the Project on GitHub zahiryahya1/2024-Fall-Gradebook-Analysis
Project Report
Tools: Excel, Python, Power BI
Type: Data Cleaning, Data Analysis
Table of Contents
- Home
- Background
- Executive Summary
- Data Source
- Analysis
- Recommendations
- Clarifying Questions, Assumptions, and Caveats
Background
This project analyzes student performance data to uncover trends in grading outcomes and evaluate the impact of specific math department policies. The main driving questions are:
- Is there a corrolation between group quiz and test score?
- Are retakes useful for improving student achievement?
- Is there a correlation between assignments turned in and test grades? While home environment and parental involvement are known major factors in academic success, this analysis focuses on assessing whether internal department policies, like group quizzes and retakes, have a measurable effect on test performance.
Executive Summary
This analysis reveals the following:
- Assignment completion rates and test scores show a weak negative corrolation (having missing assignments does not neccicarily mean a student will do poorly).
- Participation in group quizzes shows no corrolation (many students do well on group quiz and not on the test and vice versa).
- Retakes had a positive impact for many students, but the magnitude of improvement varied. Many students do not take advantage of retakes but of those who do, nearly 50% improve their scores by over 5%. The data structure was refined mid-project, which significantly improved the quality and clarity of the analysis.
Data Source
The data used for this analysis consists of 70 students in Algebra 2. Data was cleaned and reformatted to the following:
- student ID (fake)
- Gender
- Grade
- Assignment scores
Data cleaning and processing were performed using Excel and Python:
-
I used excel to clean the data. This was very time consuming and overall, the data was not “flexable” meaning it only worked for excel and not compatible with other tech tools. I applied a strategy of using a helper rows to perform calculations. It got the job done but again the process seemed messy.
-
After my initial analysis, I wanted to use power BI to perform further analysis but the data structure was not compatible. I wrote a Python script to normalized the structure into 3 tables:
- Assignment points Table: Assignment name, unit, category, points possible.
- Student Data Table: Student ID, age, grade level, and course.
- Assignemnt Data Table: Student ID, assignment name, score. This restructuring allowed for easier extraction of insight and trends via power BI. It also overall made the data easier to analyze.
Analysis Insight Deep-Dive
1. Group Quiz:
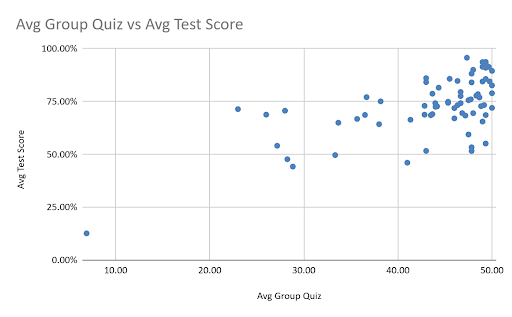
above is a scatter plot where each point respresents a student.
- Comparing any group quiz and its corresponding unit test scores, you will see that there is no corrolation. I belive this is the case because students may get help or answers from their group members without knowing how to solve the problem. An observation I have noticed amungs kids is many students are looking to just complete the work and are not satisfied with understanding the solution.
2. Missing Assignments:
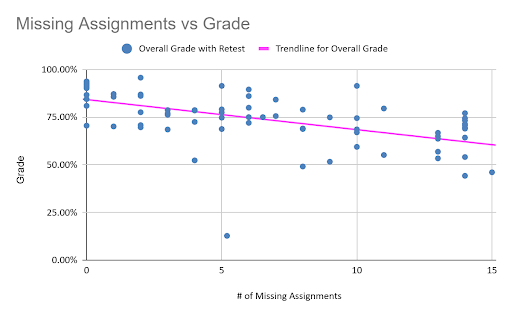
above is a scatter plot where each point represents a studnet.
- You maay have notice that there is a weak corrolation between the number of missing assignments and overall grade. It makes sense that students who practice will do well. However there are instances of students who complete practice assignments but under perform on the tests. There are 2 reasons that can explain this:
- First, students can be getting a lot of support from a tutor or friends. This is not necessarily a bad thing, however some students dont know the difference between getting help and getting the steps by step solutions.
- This leads to the Second reason, students copying unfaithfully. Again getting help or looking at the solutions can be a tool if used correctly but most students dont have the time, patients, or want to study the solution.
3. Retake Analysis:
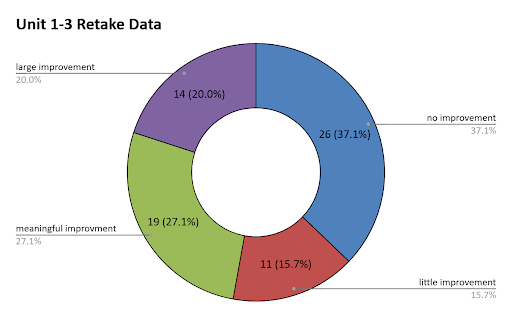
above is a pie chart that looks at all retake scores and organizes scores based on level of improvement. In total, there were 70 retakes with 148 non retakes.
- As you can see, just under 50% of students who retook scored over 5% better. A large percent of students did not improve. In order to retake, students must complete test corrections and 1 additional assignment of their choice. These requiremnts discurage non serious students from retake and also helps students learn from their mistakes and study a bit. Unfortinatly, not all students who retake are learning from their mistake. Students lack study, review, and self analysis skills. Unfortinatly there is not much time in the classroom for these, but something teachers should consider.
The table below breaks up the retake data by unit and improvement level.
| Unit | # of Retakes | # of Non Retakers | No Growth | Little Growth | Meaningful Growth | Large Growth |
|---|---|---|---|---|---|---|
| Unit 1 | 13 | 60 | 3 | 1 | 4 | 4 |
| Unit 2 | 20 | 53 | 9 | 4 | 6 | 1 |
| Unit 3 | 37 | 35 | 14 | 6 | 8 | 9 |
| Total | 70 | 148 | 26 | 11 | 18 | 14 |
Again, Not many students took advantage of the oportunity to retake, but those who did, Most did better. YUou can also see a trend of more students opting in to retake further into the semester.
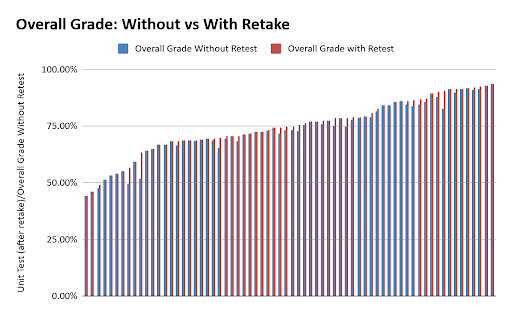
Comparing students final grades before and after retakes, you can see that students grades have increased. Some more than others.
- Average Final Grade Excluding Retakes: 74.22%
- Average Final Grade Including Retakes: 75.32%
Retakes Improved the class average by 1%
4. Finals
- Number of Students who scored better on the final: 14
- Number of students who scored worse on the final: 50
- Number of students who scored worse on the final: 6
The average student did 5% worse on the final then average test score. Students had 7 in class review days to prepare for the finals. My observation is most students were not motivated to do better and other students utilized class time to work on other subjects.
The Goal of practice assignments are to insentivise students to perform extra work so they can suceed on the exams. Practice is worth 10% of students grades.
In total, 45 students students benifited and 25 students did not. However, practice has significantly impacted 15 students grades.
- 5 students had decreased letter grade from - to +.
- 10 students had increased letter grade from + to -.
Clarifying Questions, Assumptions, and Caveats
Assumptions:
- Assignment types and categorizations were accurately labeled after restructuring.
- Students put forth sincere effort on retakes and group quizzes.
- The dataset is complete and captures all assignments, tests, and retakes for the grading period.
- excel formulas are correct
Questions:
- Do students have time outside of school to complete assignments and study?
- How many low scoring students are on their phones during class?
- what grade did students get in their previous math class?
- How many other classes are students struggling in?
This report serves as an initial exploration of student performance data. Future analysis will include a Dashboard for quick and easy visual insights. with the hopes of the dashboard being realtime and aid teacher decision making.