Massachusetts General Hospital Analysis
Project Report
Tools: SQL
Type: Data Cleaning, Exploratory Data Analysis
Table of Contents
- Home
- Background
- Executive Summary
- Data Source
- Analysis
- Recommendations
- Clarifying Questions, Assumptions, and Caveats
Background
I have been commissioned by Massachusetts General Hospital’s as a Data Analyst to create a high-level KPI report. This report includes statistical data on procedures performed in the hospital, such as total procedures, procedure length, and costs. This report provides executives with an overview of hospital operations, financial burden, payer coverage, and patient behavior to inform policy, funding, and resource allocation.
Executive Summary
Key takeaways from the analysis include:
- Total Visits: ~28,000 across 974 patients
- Average Length of Stay per Encounter: 7.26 hours
- Average Age of Patients: 70.2; Median: 53
- Readmission Rate: 854 patients readmitted (~88%).
- Patient Outcomes: 154 deaths; 820 patients currently living.
Cost Metrics:
- Average Encounter Cost: $3,640
- Average Patient Lifetime Cost: $104,224
- Out-of-Pocket Average per Patient: $72,297
- Insurance Coverage per Patient: $31,928
- Total Claim Cost: $102M; Insurance covers ~30.6%
- Out-of-Pocket Cost: Insured patients pay ~50% of the cost
- Average Procedure Cost: $2,210
- Average Procedures per Encounter: ~3
- Average Procedure Duration: ~34 minutes
Payer Insights:
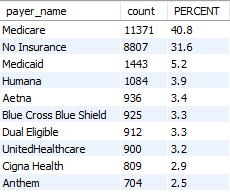
- Top Insurer by Volume: Medicare (40.8%), followed by Out-of-Pocket (31.6%), Medicaid (5.2%)
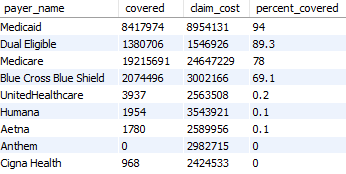
- Highest Coverage % by Insurer: Medicaid (94%), Dual Eligible (89.3%), Medicare (78%)
- Insurance vs. Non-Insurance Procedures: 68.4% of procedures were insured; 31.6% not insured
Data Source
This analysis used data sourced from Massachusetts General Hospital. Data is divided into multiple sets: Encounter.csv, Patients.csv, Payers.csv, Procedures.csv, and Organizations.csv. Encounters.csv and Procedures.csv includes details such as admission/discharge timestamps, cost and coverage breakdowns, and procedure metadata.
Data cleaning and processing were performed using MySQL:
- converting string-based date values into proper datetime formats
- checking for duplicates, missing, or inconsistent entries
- Clean column names by removing unintended characters
Analysis Insight Deep-Dive
1. Volume & Demographics
- Patients: 974 of which 854 have been readmitted.
- Encounters: 27,891 visits
- Deaths: 154 patients
- Age:
- Average: 69
- Median: 53
2. Time Analysis
- Average Length of Stay per Encounter: 7.26 hrs
- Average Total Hours per Patient: 10.23 hrs
3. Cost Overview
- Average Cost per Encounter: $3,640
- Average Cost per Patient: $104,224
- Out-of-Pocket Cost (insured patients): 40.5% of total cost
- Total Cost of Care: $102 million
- Average Insurance Payment per Encounter: $1,115
- Average Out-of-Pocket per Encounter: $2,525
- Insurance Coverage Rate: 30.6% of total cost
-
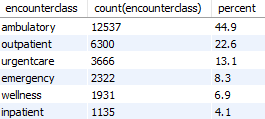
Encounter Types:
4. Procedure Analysis
- Total Insured Procedures: 19,084 (68.4%)
- Total Uninsured Procedures: 8,807 (31.6%)
- Average Procedure Cost: $2,210
- Average Procedure Duration: ~34 minutes
- Average Procedures per Encounter: ~3
5. Payer Breakdown
- Top Payers by Encounter Volume:
- Medicare: 40.8%
-
No Insurance: 31.6%
-
Top Payers by Coverage %:
Recommendations
-
Improve Insurance Negotiations with Private Payers: Many insurers cover <1% of cost, despite participating in many encounters. Advocate for better reimbursement contracts.
-
Reduce Out-of-Pocket Burden: Insured Patients are covering nearly 50% of costs. This may create financial barriers to care and increase readmissions.
-
Target Readmissions Strategically: With 88% of patients readmitted, implementing care follow-up or home health programs could reduce re-visits and lower costs.
Clarifying Questions, Assumptions, and Caveats
Assumptions:
- Average cost includes both procedures and other visit charges.
- Readmission is defined as any return visit within the dataset time window.
Questions for Stakeholders:
- Should this analysis be broken down further by department (e.g., ER vs. inpatient)?
- Should we want to analyze trends by day of week, season, or only by month/year?
- Do we care about what type of encounters are most frequent and cost?
This report serves as an initial exploration of the coffee shop’s sales data. Future analysis will include a more in-depth study, visualizations, and a Dashboard to provide actionable insights for business strategy.